Debugging
Compiler Debug Options
The tables below shows a list of debugging options for the GCC and Intel and compilers.
GCC
Option |
Action |
|---|---|
|
Generate symbolic debugging information |
|
Add runtime array bounds checking |
|
Check for uninitialized variables |
|
Trap floating point exceptions: |
|
Add debug information for runtime traceback |
Intel
Option |
Action |
|---|---|
|
Generate symbolic debugging information |
|
Add runtime array bounds checking |
|
Check for uninitialized variables |
|
Trap floating point exceptions: |
|
Add debug information for runtime traceback |
GNU GDB
GDB, the GNU Project debugger, is a free software debugger that supports several programming languages including C, C++ and Fortran. GDB has a command-line interface and do not contain its own graphical user interface (GUI).
GDB commands
To begin a debug session compile the code with the -g option to add
debugging information, and start GDB by running the gdb command adding the
executable program as argument:
$ gdb prog
Once inside the GDB environment, indicated by the (gdb) prompt, you can issue
commands. The following shows a list of selected GDB commands:
help– display a list of named classes of commandsrun– start the programattach– attach to a running process outside GDBstep- go to the next source line, will step into a function/subroutinenext– go to the next source line, function/subroutine calls are executed without stepping into themcontinue– continue executingbreak– set breakpointwatch– set a watchpoint to stop execution when the value of a variable or an expression changeslist– display (default 10) lines of source surrounding the current lineprint– print value of a variablebacktrace- display a stack frame for each active subroutinedetach– detach from a processquit– exit GDB
Commands can be abbreviated to one or the first few letters of the command name if that abbreviation is unambiguous or in some cases where a single letter is specifically defined for a command. E.g. to start a program:
   (gdb) r
   Starting program: /path/to/executable/prog
To execute shell commands during the debugging session issue shell in front of the command, e.g.
(gdb) shell ls -l
Attaching to running processes
GDB can attach to already running processes using the attach [process-id] command. After attaching to a process GDB will stop it from running. This allows you to prepare the debug session using GDB commands, e.g. setting breakpoints or watchpoints. Then use the continue command to let the process continue running.
Although GDB is a serial debugger you can examine parallel programs by attaching to individual processes of the program. For instance, when running batch jobs you can log into one of the compute nodes of the job and attach to one of the running processes.
The listing below displays a sample debug session attaching to one of the processes of a running MPI job for examining data (lines starting with # are comments):
$ gdb

(gdb) # List the processes of the MPI program
(gdb) shell ps -eo pid,comm | grep mpi_prog
14957   mpi_prog
14961   mpi_prog
14962   mpi_prog
...etc.

(gdb) # Attach to one of the MPI processes
(gdb) attach 14961
Attaching to process 14961
Reading symbols from /path/to/executable/mpi_prog...done.
...etc

(gdb) # Set a watchpoint to stop execution when the variable Uc is updated
(gdb) watch Uc
Hardware watchpoint 1: Uc

(gdb) # Continue the execution of the program
(gdb) continue
Continuing.

Hardware watchpoint 1: Uc
Old value = -3.33545399
New value = -2.11184907
POTTEMP::ptemp (ldiad=...etc) at ptemp1.f90:298
298              Vc= dsdx(2,1,ie2)*u0 + dsdx(2,2,ie2)*v0 +
dsdx(2,3,ie2)*w0

(gdb) # Set the list command to display 16 lines...
(gdb) set listsize 16
(gdb) # ...and display the source backwards starting 2 lines below the current one
(gdb) list +2
284              do k= 1, 8
285                kp= lnode2(k,ie2)
286                u0= u0 + u12(kp)
287                v0= v0 + u22(kp)
288                w0= w0 + u32(kp)
289                vt= vt + vtef2(kp)
290              enddo
291
292              u0= 0.125*u0;  v0= 0.125*v0;  w0= 0.125*w0;  vt= 0.125*vt
293
294     !
295     !----    Contravariant velocity
296     !
297              Uc= dsdx(1,1,ie2)*u0 + dsdx(1,2,ie2)*v0 + dsdx(1,3,ie2)*w0
298              Vc= dsdx(2,1,ie2)*u0 + dsdx(2,2,ie2)*v0 + dsdx(2,3,ie2)*w0
299              Wc= dsdx(3,1,ie2)*u0 + dsdx(3,2,ie2)*v0 + dsdx(3,3,ie2)*w0

(gdb) # Print a 5 element slice of the variable u12
(gdb) print u12(3006:3010)
$1 = (0.0186802763, 0.0188683271, 0.0145201795, 0.00553302653, -0.00918145757)

(gdb) # Release the process from GDB control
(gdb) detach
Detaching from program: /path/to/executable/mpi_prog, process 14961

(gdb) quit
Examining core files
Core files can be examined specifying both an executable program and the core file:
$ gdb prog core
One can also produce a core file from within the GDB session to preserve a snapshot of a program’s state using the command:
(gdb) generate-core-file
TotalView
TotalView is a GUI-based cource code debugger from Perforce It allows for debugging of serial and parallel codes. Program execution is controlled by stepping line by line through the code, setting breakpoints, or by setting watchpoints on variables. It is also efficient for debugging of memory errors and leaks, and diagnostic problems like deadlocks.
TotalView works with C, C++ and Fortran applications, and supports OpenMP and several MPI implementations including Open MPI and Intel MPI.
Starting Totalview
After compiling your MPI code with the -g flag, load the TotalView module and
start totalview with your executable, e.g. mpi_prog, by issuing the command
Open MPI:
$ mpirun -tv -np <no_of_processes> ./mpi_prog
Intel MPI:
$ totalview mpiexec -a -n <no_of_processes> ./mpi_prog
Three windows, the TotalView Root window, the Startup Parameters Dialog Box and the Process Window, will appear. Click the OK button in the Startup Parameters Dialog Box. Now click the Go button from the execution control commands in the Process Window. A popup window will ask whether you want to start the job in a stopped state. Click Yes, and the source code of your program will show in the source pane of the Process Window.
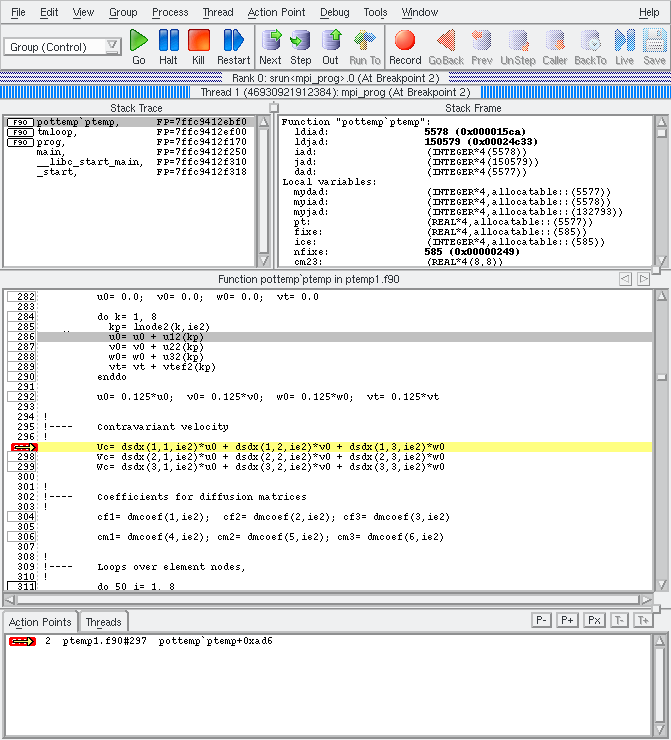
Fig. 1 - TotalView process window
You are now ready to start the debugging session doing different actions, e.g.:
Click the Step or Next buttons to go through the code statement by statement. For function calls Step goes into the function, while Next executes the function.
Create a breakpoint by clicking the line number displayed to the left in the Process Window. Click the Go button to run to this line.
Monitor a variable’s value by creating a watchpoint, select Action Points → Create Watchpoint. A watchpoint stops execution when the variable’s data changes.
Examine variables: Dive into a variable by clicking View → Lookup or double-click the variable name using the left mouse button. The Variable Window appears.
Visualize variable across processes by diving into a variable and click View → Show Across → Processes in the Variable Window.
Examine array data: Dive into an arrray variable. Display array subsections by editing the slice field in the array Varible Window. Show statistics information about the array (or a slice of the array) by clicking Tools → Statistics in the Variable Window.
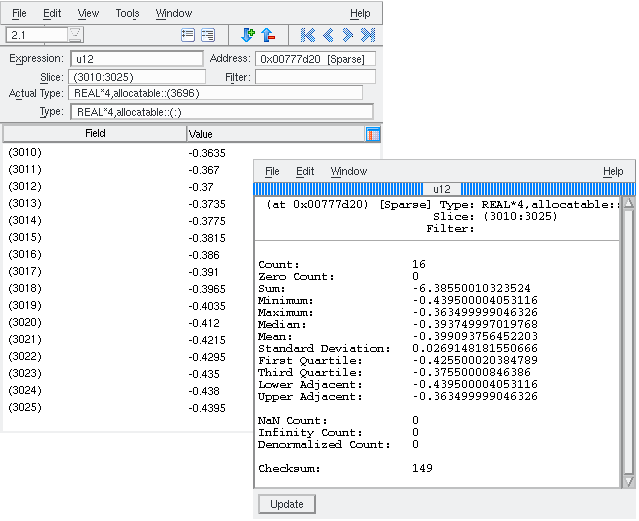
Fig. 2 - Examining data
Interactive Batch System Debugging
When running TotalView in the batch system, first start an interactive Slurm batch job session:
$ salloc --account=<my_account> --time <HH:MM> -N <no_of_nodes> bash
salloc: Granted job allocation <jobid>
Start TotalView with the executable
Open MPI:
$ mpirun -tv ./mpi_prog
Intel MPI:
$ totalview srun -a --ntasks-per-node=<ntasks> ./mpi_prog
Your program will now execute within TotalView on the number of nodes specified in the Slurm job allocation.
Note: Be sure to exit the shell created by the salloc command when
finishing the debugging session
$ exit
salloc: Relinquishing job allocation <jobid>
Further Information
For more information see the TotalView Documentation page.